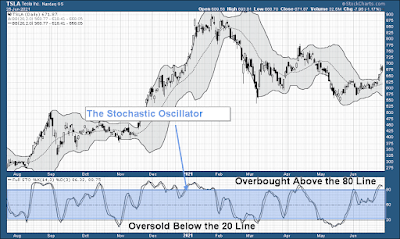
- Oscillators: These are technical indicators that oscillate between a local minimum and maximum; they are plotted above or below a price chart. Examples include the Stochastic Oscillator, Moving Average Convergence Divergence (MACD), or Relative Strength Index (RSI).
- Overlays: These are technical indicators that use the same scale as prices and are plotted over the top of the prices on a stock chart. Examples include moving averages and Bollinger Bands.
George Lane, a financial analyst, developed the stochastic oscillator in the late 1950s for use in the technical analysis of securities. He was among the first researchers to publish papers on applying stochastic indicators, especially compared to the Elliott Wave Theory and Fibonacci Retracement. In addition to gauging the strength of price movement, the oscillator can predict market reversal turning points.
Stochastic Indicator Calculations
The Stochastic Oscillator is plotted as two lines: %K and %D.%K = 100(C - L14)/ (H14 - L14)
Where:
C = the most recent closing price
L14 = the low of the 14 previous trading sessions
H14 = the highest price traded during the same 14-day period
%K= the current market rate for the currency pair
%D = 3-period moving average of %K
This formula works based on the assumption that closing prices are more important when it comes to predicting market conditions.
For example, when the oscillator gives a signal of bearish divergence, the price may continue moving higher for several trading sessions before turning to the downside. The failure of the oscillator to reach a new high alongside price action indicates an impending market reversal from an uptrend to a downtrend. You can see an example below using Apple's ($AAPL) weekly chart, where the oscillator did not confirm the new highs.
How to use the Stochastic Indicator
When the security price is making a new high or low that is not reflected on the Stochastic Oscillator, divergence occurs. It is worth noting that the Stochastic Oscillator may give a divergence signal sometime before price action changes direction.For example, when the oscillator gives a signal of bearish divergence, the price may continue moving higher for several trading sessions before turning to the downside. The failure of the oscillator to reach a new high alongside price action indicates an impending market reversal from an uptrend to a downtrend. You can see an example below using Apple's ($AAPL) weekly chart, where the oscillator did not confirm the new highs.
Similarly, a bullish divergence occurs when the market price makes a new low, but the oscillator does not move to a new low reading. Bullish divergence indicates a possible upcoming market reversal to the upside. This is the reason why it’s recommended to wait for some confirmation of a market reversal before entering a trading position. The 15-minute chart is the best time frame for day trading because it is not too fast and at the same time not too slow. Trading decisions should not be based on divergence only, but in combination with other elements.
Overbought and Oversold Levels
Another use of the indicator is to identify overbought and oversold market levels. When the Stochastic Oscillator value goes above the reading of 80, we are in an overbought market condition, which indicates that if you already have a long position, you should start reducing your position size or look for opportunities to sell the underlying asset. Conversely, when the Stochastic Oscillator value goes below the 20 reading line, it is considered to be an oversold market condition, which shows that if you already have a short position, you should start reducing your position size or actively look for opportunities to buy the underlying assetBeginner-day traders usually complain that they placed a buy or sell order during an uptrend or downtrend after seeing an overbought or oversold signal generated by the Stochastic Oscillator, which resulted in a loss.
These issues with the Oscillator are why reading technical indicators is much more of an art. Where experience and the use of other indicators and elements in combination will decrease the probability you will get a fake signal, thereby maximizing your profits.
Conclusion
When used optimally, the stochastic indicator can help you gauge price movements a lot better in both trending and range-bound markets. It is possible to develop a strategy that produces sound signals regardless of whether the market is trending or range-bound. Stochastic divergence is the most useful indicator because it can be used with other indicators to eliminate losing trades and make entry signals more accurate.I recommend back-testing the indicator, with as many charts as possible, and observing it in real-time, and see if an edge can be added to your current trading system, or simply create one from the start with the Stochastic Oscillator.


